It is inevitable you will receive error messages or your code simply won’t do what you expect it to do. Please don’t get frustrated and give up. Begin by doing the following:
Read the error message carefully. It will often point to the exact line of code that failed.
Re-run as small and simple a segment of code as possible. If it works, re-add the other code one piece at a time. This will help you identify exactly where the error occurs. For example if you have code with a long string that returns a Syntax Error, try re-running the code with a much shorter version of that string.
Once you identify which line or segment of code is faulty, check carefully for mismatched quote marks ("dbl qt vs sgl qt’), unclosed parentheses or brackets, missing commas, improperly indented code, etc.
Search online for help. Nearly any possible problem you can encounter has been encountered, discussed, and solved online already. The key to finding the answer is using the most appropriate search terms. It is best to specify the programming language (Python), the package (i.e. Pandas), a note about what you are trying to do (i.e. sort a dataframe by one column), and the error message (i.e. a “TypeError”). In fact, you may find the most help if you copy and paste the entire error message into Google’s search bar, put quotes around it to indicate you are searching for that exact phrase, and then run the search (perhaps with some other helpful terms outside the quotes, such as “python pandas dataframe”).
If you are trying to import a package or something similar and it does not work even though the exact same code worked before, try saving and then restarting Spyder/Python.
If all else fails, ask me for help. Do not get disillusioned. This is normal and part of the process.
Getting Started
check if pandas and numpy are installed
[skip to #2 if you know pandas is already installed and working.] Check to see if pandas is installed:
Open the terminal
Type to see if pandas is installed:
conda list
If not installed, install by typing (note install numpy too as it is often used in conjunction with pandas):
conda install pandas

conda install numpy
Working with Python in Spyder
In Spyder, create a new program in the editor. In the program:
First, import pandas and numpy
import pandas as pd
import numpy as np
Run this code.
Setup a data frame (see this lesson for further explanation).
There are many ways to set up a data frame. One way is to begin with a dictionary:
Now let’s try working with a larger dataset. From Slack, make sure you have already downloaded all the datasets I posted on the #datasets thread. Save them all in your Python programs folder. For this exercise, we will work with a movies dataset I downloaded from https://www.kaggle.com/. You can download the dataset from our Slack page under the the “#datasets” thread. Save it in the folder you reserved for your python programs (see b. below).
First import the packages we will need. Pandas and Numpy are needed for working with dataframes and os is needed to navigate through your computer to open the folder of our datasets.
#Working with large movie dataset
import pandas as pd, numpy as np
import os
Set the directory with the path to your Python folder where you have the movies dataset saved:
os.chdir("C:/Users/yourname/yourpythonfile")
#replace the string between the parentheses with the full path to your python folder.
For Windows, the directory will usually begin with “C:/Users/….” For Macs, this will begin with a “/”. To find the full path of your folder do: i. Windows: right-click on it and select “Properties” ii. Mac: click and select “Get Info”
Open the dataset:
movies=pd.read_csv("movie_metadata.csv")
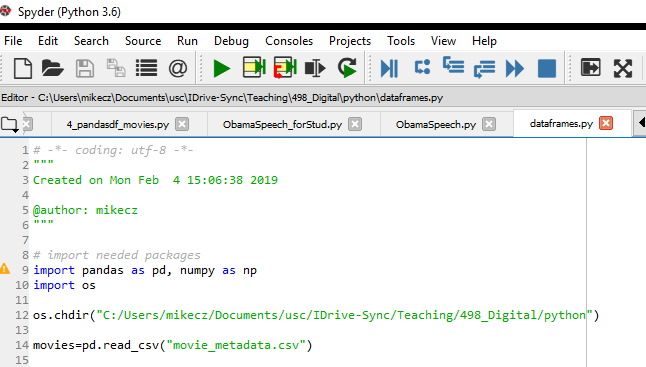
To review, the beginning of your program should look like this:
Spyder/Python screenshot: working with pandas dataframes
Review the data frame by running the following commands one at a time. What does each command do? Record what each does as a comment (#) next to the command.
movies.shape  #returns the number of rows and columns in the dataframe
movies.columns.values
movies.describe()
movies.info()
movies.head()
movies.head(3)
movies.iloc[:,11:19].head()
movies.iloc[0:5]
movies.iloc[:,0:5]
You can apply some of these functions to just one column at a time. There is often also many different ways to accomplish the same thing. For example, to just see the first 10 movie titles, you could type:
 i. **movies** calls for the entire movies data frame
 ii. **movies['movie_title']** calls only for the column "movie_title" within the movies dataframe
 iii. Adding **.head(10)** or **[0:10]** calls only for the first ten rows of that particular column
 iv. **iloc** calls a particular row, column, or cell by its numbered position. Thus, as we are looking for the first ten rows (remember [0:10] in Python calls for the range of numbers between 0 and 9) and 'movie_title' is the twelfth column (assigned 11 because Python starts with 0) we call for the position **.iloc[0:10,11]**.
Exercise A:
Using or modifying the above code, identify:
the number of rows and columns in the movies dataframe
the name of the movie in the 1000th position or row in the dataframe
for how many movies are we missing data for the film’s budget?
For columns (variables) with numerical data, identifying the average, maximum, minimum, and quartile (i.e. 25% / 75%) values is helpful to understand the range of values recorded. For example, if you want to retrieve these summary statistics for the gross (revenue) of each movie do the following:
find the variable name for gross revenue by reviewing the names of columns
movies.columns.values
What is the name of this variable? Insert in the code below, which retrieves summary statistics.
movies['INSERT_VAR_NAME_HERE'].describe()
Python should return something like this:
count    4.159000e+03
mean     4.846841e+07
std      6.845299e+07
min      1.620000e+02
25%      5.340988e+06
50%      2.551750e+07
75%      6.230944e+07
max      7.605058e+08
Name: gross, dtype: float64
The mean is the average gross income reported for the movies in the database. It also reports the minimum, maximum, median (50th percentile), 25th percentile, and 75th percentile values. The numbers might seem foreign. But, here is an easy explanation: e+02 means you have to multiply the number by 10 to the power of 2 (or 100), e+06 by 10 to the power of 6 or 1 million.
For a super easy way to read these numbers: just simply move the decimal point to the right the the number of digits given. Thus for 6.846841e+07 just move the decimal point 7 places to the right. The result is: 6845299x (“x” because we don’t know the last digit), or more simply, about 68.45 million. Thus, the average gross receipts or income for the movies in this dataset is $48.5 million, the minimum is $162, and the maximum is $760 million.
Note, as is often the case, the median (50%) figure is significantly different than the average (mean). This is common and just represents an uneven distribution. In this case, there are more low-earning movies than high-earning movies, but the higher number for the average ($48.5M vs $25.5M for the median) reflects how the huge numbers for the Avatars, Lord of the Rings, and Titanic-type movies skew the average.
Exercise B:
Identify:
the lowest, highest, mean (average), and median budget for films in the dataset
the highest and lowest imdb scores.
There are several types of data. On one hand, you can have different data types (strings [i.e. ‘word’], integers [2], floats [2.58]). On the other, you can have continuous or discrete data.
Continuous data can take place anywhere within a given range of values. For, example, between 1 and 2 you might have 1.21, 1.23, 1.38, 1.43, etc. or even 1.431, 1.4310002… you get the point.
Discrete data can only be found at certain intervals. For example, strings are nearly always discrete, with the possible exception of identifiers such as license plates (ABC 123, BBC 123, CBC 123, DBC 123, etc.). Numbers may be discrete too. For example, integers can only be found at whole numbers (1,2,3, etc.) and not between (1.5).
With this distinction in mind, we can identify frequency counts for all discrete data in our datasets. For example, how many movies from this dataset were made in 1995?
To quickly retrieve frequency counts for a particular column in our dataset, type:
movies['title_year'].value_counts()
What year is most frequently represented in this dataset? Least?
Sorting, Filtering, and Subsetting Dataframes
Often, you may want to filter and extract a subset of a dataframe to analyze, for instance, all films made in black and white. At other times it is useful to sort the dataframe (i.e. from top rated to lowest rated movies).
Imagine you want a list of the top-grossing films in order. One way to sort the dataframe is to use the sort_values(). Try this:
movies.sort_values('gross')
You may notice two problems. First, it returned but did not save the new, sorted dataframe. We need to assign this results to a new dataframe. Second, it sorted the movies into ascending order, leaving the highest-grossing at the bottom. To fix this, try instead:
sort_values() is the function that, you guessed it, sorts a dataframe based on the values in a specific column
‘gross’ specifies we are sorting based on the column titled “gross”.
Ascending=False instructs the sort_values function to sort in descending order
The results are assigned to a new dataframe called “topgrossing”.
We can now view the top 25 grossing films by typing:
topgrossing.head(25)
However, that prints out the whole dataframe. Instead, we could save only the titles, years, and leading actors for the top 25 films by doing the following:
Print out the top 25 in this dataset using .head(25). Notice that not only did we subset out only 3 columns into the new dataframe, we also changed the order of these columns. The actor name was previously before the movie title.
Exercise C:
Identify:
The top 15 rated movies in the dataset by imdb score. Create a new dataframe with the movie title, year, budget, and imdb score. Print out the top 15.
How many, if any, have you seen?
Creating a New Column
Now, let’s create a new column. We have data for the budget or expense of each film as well as the revenue or gross receipts. We can now create a column to calculate the net income (revenue - expenses) of each film.
Now, view the head of your dataframe to see what the new column looks like. You can also use the head command to just view the first few entries of one column alone:
As you can see, the most profitable movies are not that different from the top grossing. Instead, it may be more useful to calculate the most profitable by percent of the budget (i.e. a movie with a budget of $100M that makes $200M made a profit of 200%). Thus, the math is percentprofit = (gross - budget) / budget. To convert to a percentage (20%) rather than a decimal (0.2) just multiply by 100 (i.e. gross / budget * 100). Note: use parentheses to indicate you want to perform the subtraction before the division. Calculate the top 10 most profitable movies by percent.
What genre of film appears to be most profitable according to this calculation?
You should get a much different list than our list of most profitable films by absolute dollars.
Subset by Condition
We can also filter our dataset by a condition. What movies were made in black and white? Received a imdb score over 9? Made a profit of 1000%? These are all questions we can ask. To filter by year, for example, we just type:
after2000=movies[movies['title_year']>2000]
To explain:
We begin with the movies dataframe.
We select only those rows in which the values for the column ‘title_year’ are greater than 2000. In this particular method, we must specify the column AND the dataframe of the column. Hence, movies[‘title_year’] is in the [brackets] not just the column name (‘title_year’).
We assign this subset of our dataframe to a new dataframe called “after2000”
Exercise E:
How many movies were made before 1960?
Use the code above with the .shape command to identify the number of movies in the dataset made before 1960.
You have now learned some of the most useful ways of examining, modifying, filtering, and sorting a dataset.
To test your newfound skills, try this one last exercise:
Final Exercise
Using the Python and Pandas functions learned above, complete the following task:
Identify the director who made the most movies (in this dataset) in the last 25 years. How many did he or she direct during this time?
How many women are in the top 20 of this list?
How much total net profits have the movies of our most prolific director made in the past 25 years? Note: for the final calculation adding up the total profits of this director’s movies, you will need to try the .sum() command. It should look like this: dfname[‘colname’].sum()
Extra Credit
Note: This will involve learning some new skills on your own. Only attempt if you have the rest of your assignments done and are feeling adventurous.
Choose one of the following questions to answer:
What percent of these movies are comedies? (Note: you will have to figure out how to split the list of genres for each movie) How does their average net profits and imdb scores compare to the dataset as a whole?
What actor appears the most frequently in this dataset for movies made this century? (Note: you will have to draw on data about actor 1, actor 2, and actor 3.)